More things might be different now
8. Comparing 2+ groups (ANOVA)
If we wanted to compare 2 group means, t-tests are great. To compare means of 3 or more groups, the ANOVA (ANalysis Of VAriance) test is the way to go.
ANOVA is a statistical tool that helps us compare the means of 3 or more groups (it can also be used to compare 2 groups, but t-tests are more common for that). It is used to determine if there are any significant differences between group means of a continuous variable (height) and the several groups defined by a categorical variable (dog breeds: golden retrievers, pugs, and St. Bernards).
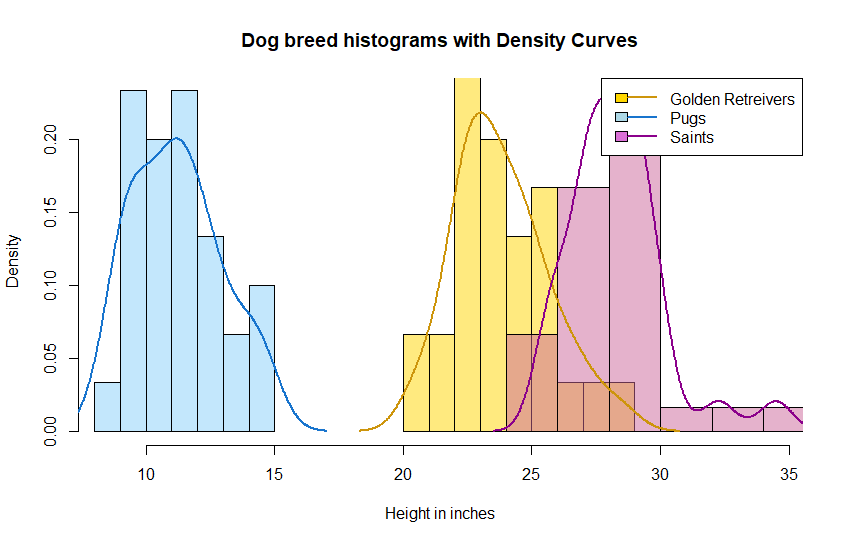
With ANOVA, we will see if there is a statistically significant difference between ALL groups. ANOVA could tell us golden retrievers, pugs, and Saint Bernards have different heights from one another, but not that St. Bernards are taller than pugs or golden retrievers. ANOVA by itself does not tell us which group is greater or smaller than the others. There are methods to do this, and we will mention those methods, too!
Like any other statistical test, we need to satisfy certain assumptions to properly run an ANOVA test. Firstly, we assume that the data within each group follows a normal distribution. Secondly, the variances within each group should be equal. Lastly, the observations in each group should be independent. These are the same as the t-test assumptions!
Next, we establish our hypotheses. The null hypothesis (H0) in ANOVA states that there are no significant differences between the group means. The alternative hypothesis (Ha) suggests that at least one group mean is significantly different from the others (remember the ANOVA itself cannot tell you which is smaller or greater than the others).
Just like a t-test, an ANOVA uses the means, standard deviations, and two degrees of freedom (n -1 and number of groups -1) to create a test statistic. To calculate the test statistic in ANOVA, we use the F-statistic. The F-statistic compares the variability and differences between a combined mean of all groups and each group. A higher F-statistic usually signals higher group differences in means and lower group variance. How to calculate the F-score is explained in the Khan Academy videos below. Let’s say we obtained an F-score of 3.2.
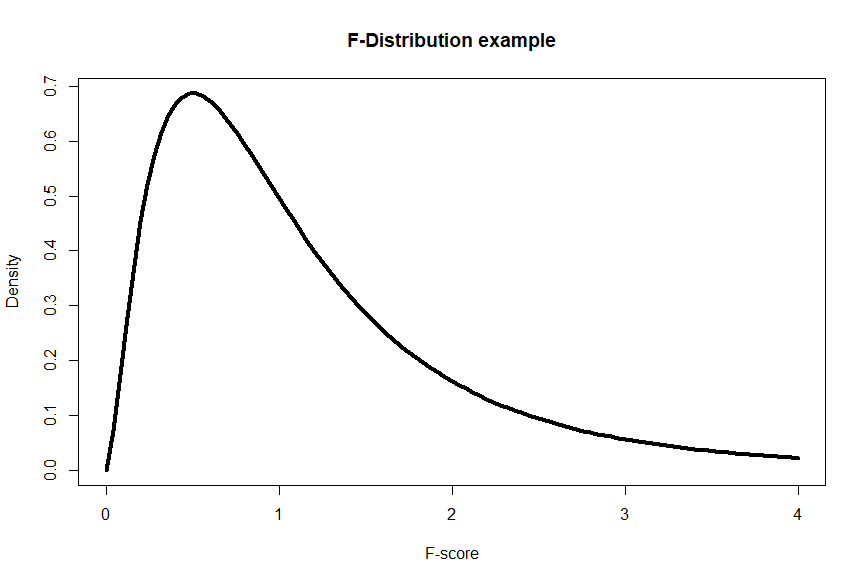
We can compare the F-score in a F-score probability table or use a statistical software to obtain a p-value and compare it against the critical threshold (commonly set at 0.05). If the p-value is less than the critical threshold (p < 0.05), we reject the null hypothesis in favor of the alternative hypothesis. This indicates that there is evidence to support the claim that there are significant differences between the group means. Conversely, if the p-value is greater than or equal to the critical threshold (p ≥ 0.05), we fail to reject the null hypothesis. This means that the evidence does not provide strong support for significant differences between the group means.
Running through an ANOVA test calculations in 3 Parts with Khan Academy videos: Part 1, Part 2, Part 3.
Post-hoc analysis
Because ANOVA does not yield results about which group is greater or smaller in means than others, we often conduct another analysis to determine which groups differ from one another. A post-hoc analysis is performed when we reject the null hypothesis from an ANOVA test. The post-hoc analysis helps us identify which specific group means are significantly different from each other. For example, if our ANOVA test yields a significant result when comparing our three dog breeds, we can use post-hoc tests, such as the Tukey HSD test (HSD stands for Honestly Significant Difference) or Bonferroni test, to compare each pair of breeds ( golden retrievers versus pugs, pugs versus St. Bernards, St Bernards vs golden retrievers) to one another to determine which groups significantly differ in height.
For a video on more about the Tukey Honestly Significant Difference and how to calculate it, check out this video.
In conclusion, the ANOVA test is a valuable statistical tool used to compare means between three or more groups. By assessing assumptions, formulating null and alternative hypotheses, calculating p-values and test statistics, and comparing them to critical thresholds, we can draw meaningful conclusions from data. Want to know if a company is significantly charging you more for certain products? With the right data, now you can tell. Want to see if your invention is faster and safer than the competition? Collect and analyze that data and you’ll be able to tell. And most importantly, you can compare heights between so many things! Dog breeds, plant breeds, buildings in different countries- the world is your height comparison oyster!
ANOVA (Analysis Of Variance) is a statistical test used to compare the average (mean) of a variable, like height, across three or more different groups, such as different dog breeds. It helps us determine if there are any significant differences between these groups, but it doesn’t tell us which specific groups are higher or lower than the others without additional analysis.