χ² marks the spot
9. Comparing frequencies (chi-square)
So far we’ve seen techniques to compare between group means, but what if we want to compare between groups using variables that aren’t continuous? What if we want to know that the hypothetical dog park has a higher number, or frequency, of golden retrievers than pugs and St. Bernards? Sure, we’ve seen 600 golden retrievers, but how do we really know that we aren’t just overlooking pugs because we hang out with the dogs that can run and don’t get winded from walking up 2 stairs? Maybe many pugs and St. Bernards don’t know how to catch frisbees as well as golden retrievers? To answer these types of questions, we can use the chi-square test.
The chi-square test is a statistical tool that helps us examine the relationship between categorical variables. (As a reminder, continuous variables change smoothly [like temperature], while categorical variables are divided into distinct groups [like dog breeds]).
Chi-square is used to determine if there is a significant association or difference between categorical variables.
Let’s say we did some more strange sampling at the dog park and found the following information about frisbee catching among our 3 dog breeds.
| Golden Retrievers | Pugs | Saint Bernards | |
|---|---|---|---|
| Catches Frisbee | 52 | 12 | 18 |
| Drops Frisbee | 8 | 48 | 42 |
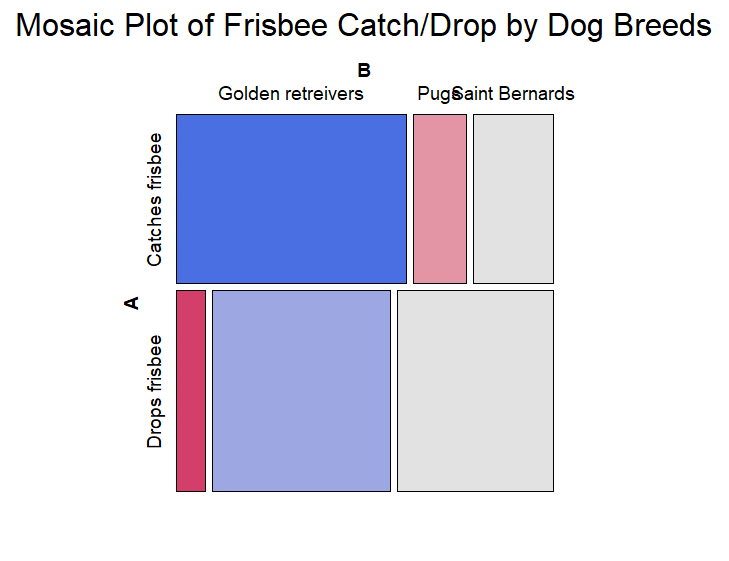
This might give us an idea that golden retrievers seem to catch frisbees at a higher rate than pugs and saint bernards. If you aren’t a fan of tables, we can also visualize this through a mosaic plot shown below. The top row of the mosaic plot shows rectangles among the dog breeds and these rectangles are proportional to the size of catching frisbee ability among the breeds. Golden retrievers have the highest proportion and frequency of catching frisbees, so the blue rectangle is largest for golden retrievers in the first row of the plot. The opposite is true in the drops frisbee row, where golden retreivers make up the smallest proportion of this group, so are represented by a small pink rectangle.
Different types of chi-square tests are available, including the chi-square test of independence and the chi-square goodness-of-fit test. The chi-square test of independence is appropriate when we want to analyze the relationship between categorical variables, such as frisbee catching ability and dog breed, plant fruit type and plant family, and banks and type of investment software. Like an ANOVA test, the test of independence cannot tell us which group has higher frequencies of the other categorical variable and can only tell us if a difference exists. For example, the test of independence could tell us that St Bernards, pugs, and golden retrievers know how to catch frisbees at different frequencies, but not if golden retrievers know how to catch frisbees more than the other two breeds (we can use post-hoc analyses to determine group different directionality, just like with ANOVA post-hoc tests). The chi-square goodness of fit test is used to compare observed frequencies to expected frequencies within a single categorical variable, ie, to determine if there are fewer pugs at the park than golden retrievers.
Before conducting a chi-square test, we need to satisfy certain assumptions. The main assumption is that the data we are analyzing consists of frequencies or counts in different categories. Additionally, for the chi-square test of independence, we assume that the observations are independent (the presence of one pug does not affect if a golden retriever comes to the park) and the data come from a random sample.
Chi-square tests include the goodness of fit test and the test of independence. Let’s walk through what the hypotheses look like for each type of test.
For the goodness of fit test, we are seeing if the frequencies of a categorical variable are significantly different between each group. For example, the frequency of pugs and golden retrievers at the dog park may be different. Our null hypothesis (H0) would be that there is no difference in frequency between pugs and golden retrievers at the dog park. Our alternative hypothesis (H1) would be that pugs and golden retrievers are at the dog park at different numbers.
For the test of independence, we are seeing if two categorical variables are associated with one another. This test could be used to determine if golden retrievers know how to catch frisbees (either yes or no of knowing how) at a different frequency than St. Bernards and pugs. The null hypothesis (H0) for this test is that there is no difference in the frequency of knowing how to catch a frisbee between golden retrievers, pugs, and St. Bernards. Our alternative hypothesis then is that there is a difference in frequency of knowing how to catch a frisbee between golden retrievers, pugs, and St. Bernards. The test of independence gives you an overall difference between groups, but directionality, or which group has a higher frequency of the variable of interest (knowing how to catch a frisbee) than the others. For that, we would conduct a post-hoc chi-square test, which for simplicity will be discussed below if you are interested.
For either chi-square test, the test generates the chi-square statistic (χ²). χ² is the test statistic for chi-square statistical tests. This statistic measures the difference between observed and expected frequencies in each category. We then compare χ² against the χ² distribution to generate a p-value. The p-value tells us the probability of obtaining the observed data. Like all the other statistical tests covered so far, interpreting the p-value involves comparing it to a predetermined critical threshold, commonly set at 0.05 (5%). If the p-value is less than the critical threshold (p < 0.05), we reject the null hypothesis in favor of the alternative hypothesis. This indicates that there is evidence to support the claim of a significant association or difference between the variables. When testing to see if dog breed knowledge of how to catch frisbees differ between golden retrievers, pugs, and St. Bernards, if we saw the χ² test statistic yielded a significant p-value, we would reject the null to support the claim that there is a difference between frisbee catching knowledge between the breeds. If we conducted a post hoc test (though not going into it here) next and saw significant differences in frisbee catching frequency between golden retrievers vs pugs, and golden retrievers vs St. Bernard’s, we can conclude that golden retrievers know how to catch frisbees more than the other breeds if the frequency was higher for golden retrievers.
In conclusion, the chi-square test is a valuable statistical tool used to analyze the relationship within and between categorical variables. The chi square test can help us determine differences between types of cars between competing dealerships, the number of endorsements between influencers, and if plants that are fertilized are different colors than plants that aren’t fertilized. The tests are extremely useful and are used frequently in data science. Another extremely common and useful statistical tool is the correlation. That is the topic of our next lesson!
You can find out how to calculate a chi-square test with this video from Khan Academy.
The chi-square test is a statistical method used to compare frequencies or counts in different categories, like seeing if one dog breed is more common than another at a park. It helps us understand if there’s a significant difference in the frequency of categorical variables, such as dog breeds or plant types.